A/B Testing Optimization using Machine Learning
The Challenge
Imagine you're running a fast-food chain with stores across different cities. Some stores are brand new, others have been around for decades. Some are in big cities, others in smaller towns. You have three different marketing promotions to choose from, but you're not sure which one works best. Should you use the same promotion everywhere, or should you tailor them to different stores?
This case study serves as an example of how data science can help in A/B Testing and guarantee through statistical methods to get the best result for the organization. The whole Python Notebook can be found on my Github.
What I had to work with
I used a publicly available dataset from Kaggle which had data How much they sold during the promotion
How old the store was
Whether they are in a small, medium, or large market
Which of the three promotions they used
Initial data discovery (Store Age and Promotion Performance)
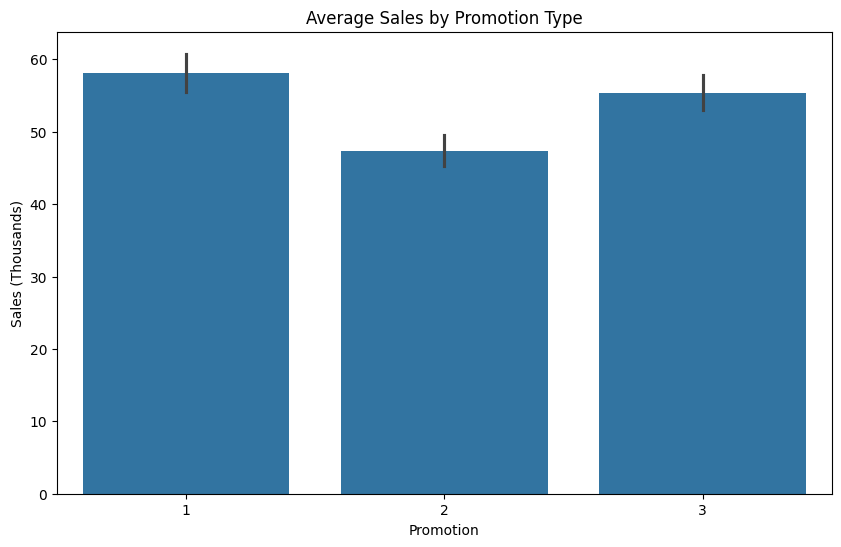
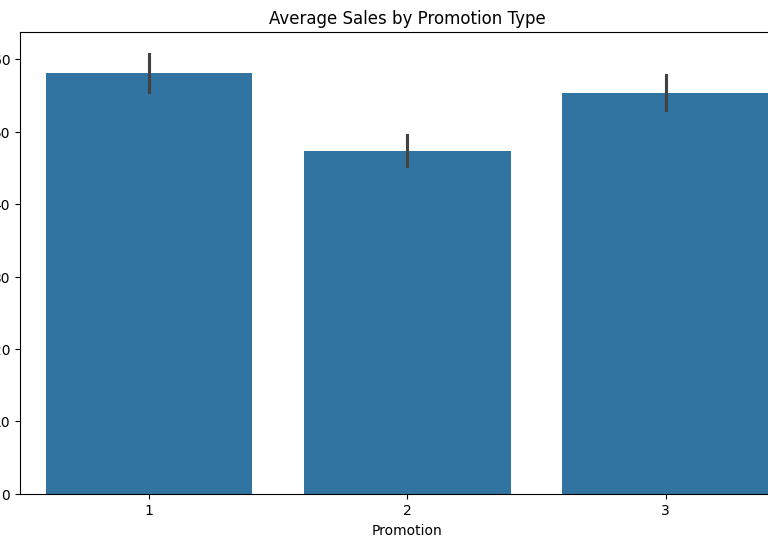
First I did a basic data analysis to see how did the promotions do in its most basic sense (average sales per promotion).
As can be seen in the figure below, Promotion 1 did the best, closely followed by Promotion 3 and Promotion 2 far behind.
The plot was created using Python's seaborn library.
We could in principle call it a day here and just say Promotion 1 is the best. However, this would not be accurate enough considering we have all these different stores with different market sizes and characteristics.
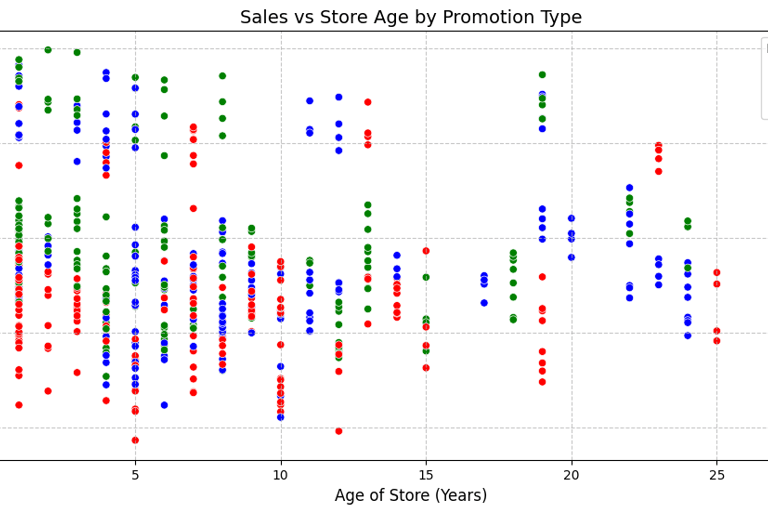
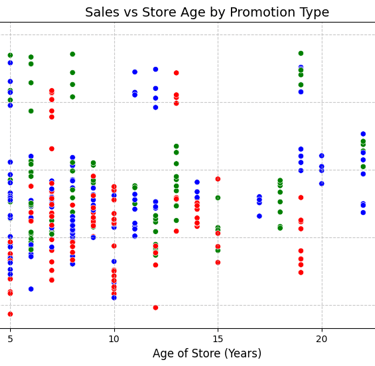
I therefore went ahead and created a scatterplot to see how sales of promotions are affected by the age of stores.
The interesting finding here was that Promotion 1 seemed to do better with very young stores (under 5 years old), performs bad in middle aged stores (10-18 years old) and picks up a bit in older stores.
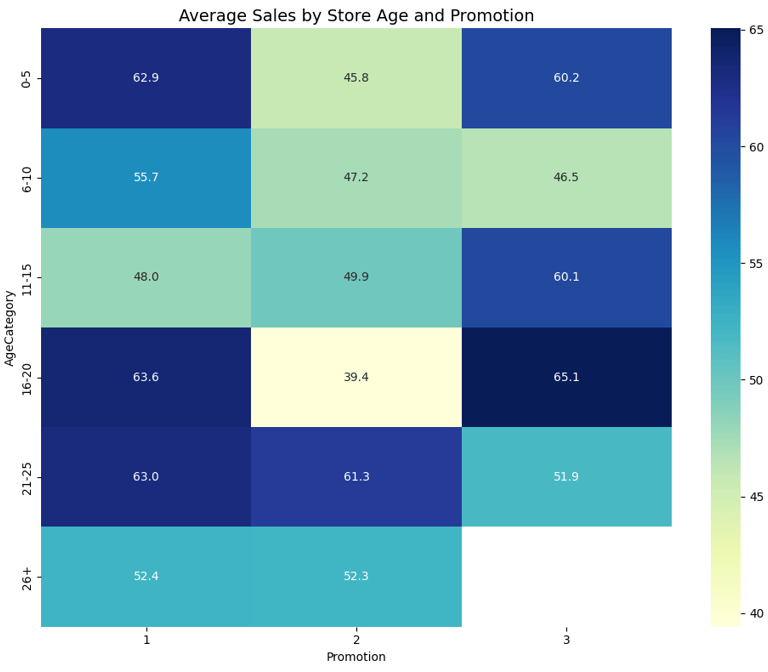
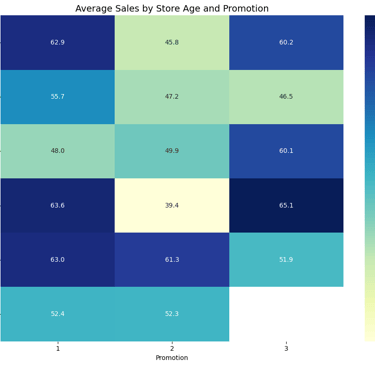
In order to fully determine how well promotions perform based on the store age though I created groups of the different store ages and how each promotion performed using a heatmap. The determination for this was that for younger stores Promotion 1 would be the best bet. Middle aged stores (11-20 years) Promotion 3 shines and for older stores (21+ years) Promotion 1 is usually the best bet with Promotion 2 coming close.
Initial data discovery (Market Size and Promotion Performance)
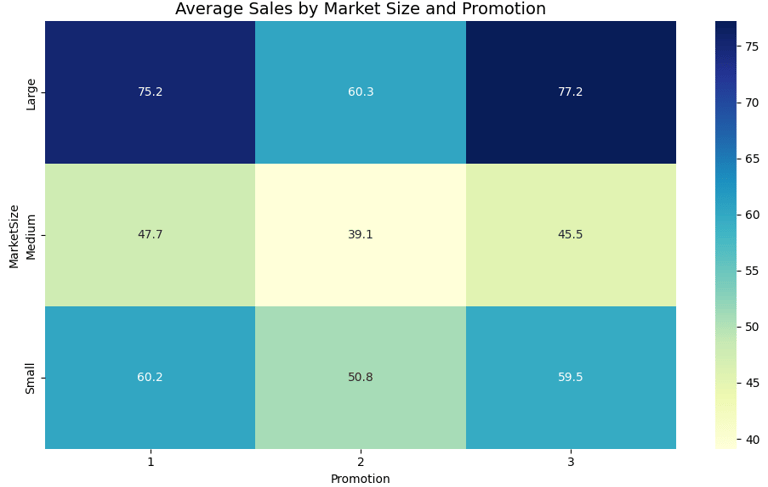
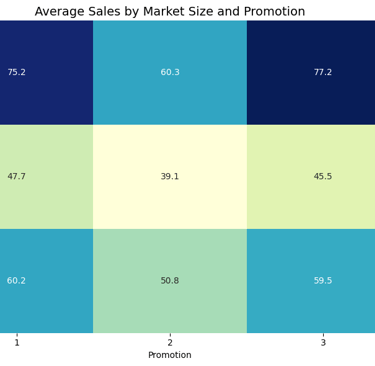
Since store age was only one part of the equation, I also had to look at the market sizes of each store and how the promotions performed. Similarly for this I created a heatmap to easily discover trends. Larger markets seemed to do similarly with Promotion 1 or 3 but Promotion 3 seemed to outperform Promotion 1 slightly. Medium markets seem to need a new promotional strategy altogether as their average sales were quite low. Promotion 1 and 3 also performed similarly in small markets with Promo 1 slightly winning. Promotion performed bad in all market sizes.
Initial data discovery (Findings)
So in general it seems that using Promotion 1 throughout would be a safe bet as it consistently performed the best amongst most groups and categories. However, we also have to look at the interaction between store age and market size which is why in the next step we created models that predicted how well promotions would do when both factors are considered.
Statistical Modeling (OLS)
Ordinary Least Squares (OLS) aims to minimize the sum of squared differences between observed and predicted values. What does that mean? It estimates the relationship between one or more independent variables (predictors) and a dependent variable (response).
In this scenario we used OLS in three models.
Model (Basic)
Simple model with just promotions using Promotion 1 as a reference and using the Sales in thousands as predictors.Promotion 1 had the highest average sales.
Model (Controlled)
Added controls for market size and store age to determine their interactions on the overall promotion success.
Promotion 1 performed the best.Model (Time effects)
Incorporated week effects to understand how promotions perform over time. This provided the most complete picture of promotion effectiveness.
Promotion 1 performed the best, Promotion 2 should be avoided and Promotion 3 performs similar to Promotion 1.
So based on traditional data discovery and statistical methods we can see that Promotion 1 is the best with Promotion 3 coming close and Promotion 2 performing very bad.
But since these are only traditional and common techniques I wanted to challenge myself more and apply some Machine Learning techniques to determine the best overall promotion. In this case I used Uplift Modelling to do so.
What is Uplift Modeling?
Uplift Modeling is a data science technique used to estimate how much a particular action (like running a promotion) actually changes behavior compared to what would have happened if you didn't take that action.
In this project I wanted to see if matching specific promotions to certain segments (market size and store age) would boost sales compared to just running one promotion everywhere.
How it was approached
Compared Scenarios:
For every store, we used machine learning to predict what its sales would be under each of the three promotions, regardless of which promotion was actually used in reality.Calculated Uplift:
We then measured, for each store or segment, the difference in predicted sales between using (for example) Promotion 3 versus Promotion 1. This difference is the “uplift” the estimated gain (or loss) attributable to switching the promotion. For example, if Store A would sell $60,000 with Promotion 1 and $68,000 with Promotion 3, then the uplift for switching to Promotion 3 is $8,000.Segmented by Store Characteristics:
We didn’t just do this for all stores as a lump group. Instead, we grouped stores by market size and age, and checked which promotion gave the highest uplift for each segment.Tested Personalized vs. One-Size-Fits-All:
Finally, we compared two big strategies:Always use the overall best promotion for every store.
Use the uplift modeling results to tailor the promotion for each segment, using the promo that gives the highest predicted uplift there.
We applied three different models.
- Meta-Learner (S-Learner): - Trains a single regression model with Promotion as a feature. - Predictive simulations to estimate expected sales for each store under each promo.
- T-Learner: - Builds three separate models (one per promotion) for counterfactual prediction in each segment.
- Heterogeneous Treatment Effects (HTE): - Computes and visualizes differences in predicted sales when switching promotions, by segment. - Treatment effect plots help understand where one promo outperforms another.
What did we learn from Uplift Modeling?
It made it possible to simulate “what if” scenarios: What would have happened in each store if we had run a different promotion?
We found that tailored promotions didn’t beat the best overall promotion: Even though uplift modeling helps find local “winners” in some segments, the overall gain from segment-specific strategies was tiny so complexity wasn’t warranted.
It identified clear losers: Promotion 2, for instance, had negative uplift for every segment, so we could avoid it entirely.
Why is Uplift Modeling important?
Focuses your resources on where interventions (like promotions) will truly change behavior, not just on people who always buy anyway.
Prevents waste: You avoid spending on customers who won’t respond, and don’t risk irritating those who might react badly to a promotion.
Gives clear evidence-based strategies: Rather than just guessing or relying on averages, decisions are driven by predicted cause-and-effect.
Conclusion
Promotion 1 is the top performer consistently delivering the highest sales across nearly all store ages and market sizes.
Promotion 2 performed poorly everywhere and should be avoided.
Promotion 3 had some minor advantages in select segments but not enough to justify a complex, segmented approach.
Uplift modeling did not provide better results than simply using the best overall promotion. However, it is still valuable because it identifies where targeted strategies might work, exposes promotional “losers,” and ensures you’re not wasting resources on ineffective campaigns. Uplift modeling also gives clear, evidence-based insights for decision-making preventing costly mistakes and improving future strategies.
Key takeaway: Stick with Promotion 1 for simplicity and strong results, but keep leveraging uplift modeling for ongoing evaluation to spot opportunities and avoid ineffective promotions.
Promotion 1 is your safest bet, Promotion 2 should be skipped, and uplift modeling even if it doesn't beat a one-size-fits-all approach remains a powerful tool for smarter, more efficient marketing decisions.
Connect
Let's collaborate on data-driven projects together.
© 2025. All rights reserved.